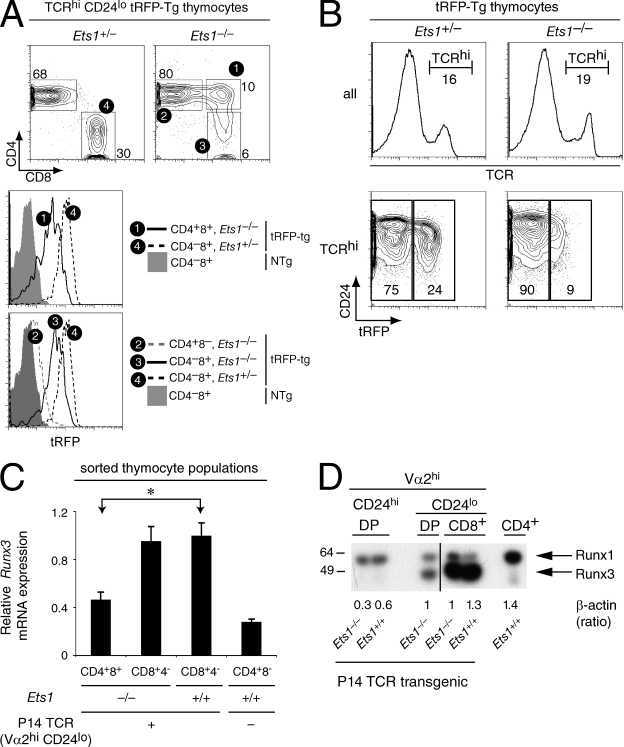
Figure 6.
Ets1 promotes Runx3 expression. (A and B) Expression of Runx3 was evaluated in mice carrying a BAC transgene in which a tRFP cDNA has been inserted within the second exon of Runx3. (A) Two-parameter contour plots of CD4 and CD8 expression (top) are gated on TCRhi CD24lo thymocytes from Ets1+/− and Ets1−/− mice. Subsets defined by boxes are numbered and analyzed for tRFP expression. Overlaid histograms (bottom) depict tRFP fluorescence in indicated subsets of tRFP-transgenic Ets1+/− and Ets1−/− mice. Gray-shaded histogram show background fluorescence in CD8 SP thymocytes from control Ets1+/+ nontransgenic mice. The mean intensity of tRFP fluorescence in subset 1 (maturelike DP cells from Ets1−/− mice) was 49% of that in subset 4 (CD8 SP cells from tRFP-transgenic Ets1+/− controls; mean on all three experiments). (B) Two parameter plots of tRFP and CD24 expression (bottom) are shown on TCRhi gated cells (histograms, top). Data (A and B) is representative of three mice of each genotype analyzed in three separate experiments. (C) Expression of Runx3 was assessed as in Fig. 4 on the same mRNA preparations and is shown relative to that in Ets1+/+ P14 CD4−CD8+ cells. The difference between Ets1−/− Vα2hi CD24lo DP and Ets1+/+ CD8 SP thymocytes for Runx3 expression was statistically significant (*, P < 10−4, two tailed Student's t test). Data are from more than three experiments. (D) Expression of Runx proteins was assessed in sorted thymocyte subsets by immunoblotting with an antibody directed against the Runt domain and recognizing both Runx1 and Runx3. CD4 SP thymocytes were sorted from wild-type mice and used as positive and negative controls for Runx1 and Runx3 expression, respectively. MW marker sizes are indicated on the left. Numbers underneath indicate expression of β-actin in each samples, quantified on the same membrane and expressed relative to that of wild-type CD8 SP thymocyte. The β-actin signal was consistently lower in DP thymocytes than in other cell subsets, but was not reproducibly affected by Ets1 disruption. The figure is a composite of two parts of a single blot (separated as indicated by the vertical black bar). Data are from three determinations performed from two distinct sets of sorted cells.

