Figure 5.
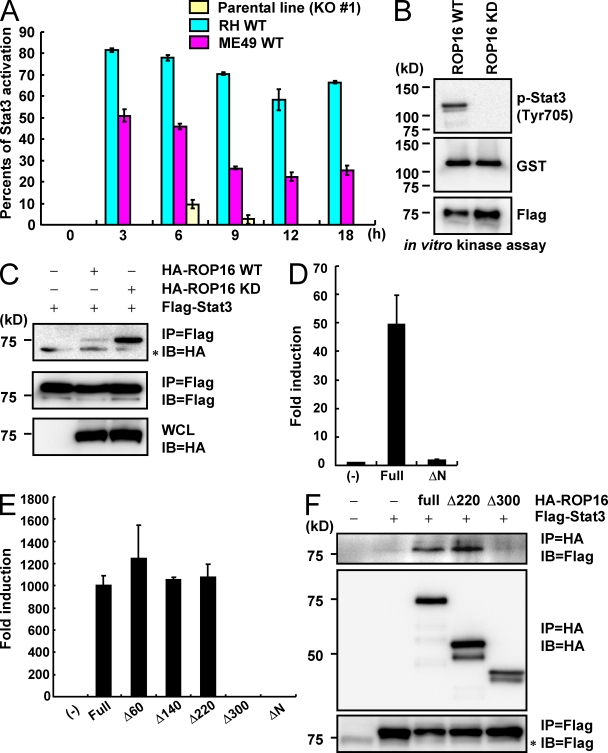
Direct Stat3 activation by ROP16. (A) Relative Stat3 phosphorylation levels. Serum-starved MEFs were infected with an MOI = 10 of the indicated parasites for indicated times. The intensity of Stat3 phosphorylation observed by immunoblotting with anti–phospho-Stat3 antibody was quantitated using a phosphoimager and normalized to images of total Stat3, as shown in Fig. S5. Each count from which that of the uninfected point was subtracted was shown. (B) 293T cells were transiently transfected with Flag-tagged ROP16WT or FLAG kinase–inactive ROP16KD. Cell lysates were immunoprecipitated with anti-FLAG and subjected to an in vitro kinase reaction in the presence of GST–Stat3. Proteins were separated on SDS-PAGE, followed by Western blotting to analyze Stat3 phosphorylation, GST-Stat3, and Flag-tagged ROP16WT or ROP16KD by anti–phospho-Stat3 (Tyr705), anti-GST, and anti-Flag, respectively. (C) Lysates of 293T cells transiently cotransfected with 2 µg Flag-tagged Stat3 and/or 2 µg HA-tagged ROP16WT or ROP16KD expression vectors were immunoprecipitated with the indicated antibodies. *, nonspecific bands. (D and E) 293T cells were transfected with the indicated Stat3-dependent luciferase reporters together with indicated expression vectors. Luciferase activities were expressed as fold increases over the background levels shown by lysates prepared from mock-transfected cells. (F) Lysates of 293T cells transiently cotransfected with 2 µg Flag-tagged Stat3 and/or 2 µg HA-tagged ROP16 full-length, Δ200, or Δ280 expression vectors were immunoprecipitated with the indicated antibodies. *, nonspecific bands. Indicated values are means ± the variation range of duplicates. Data are representative of three (A, C, and E) or two (B, D, and F) independent experiments.

