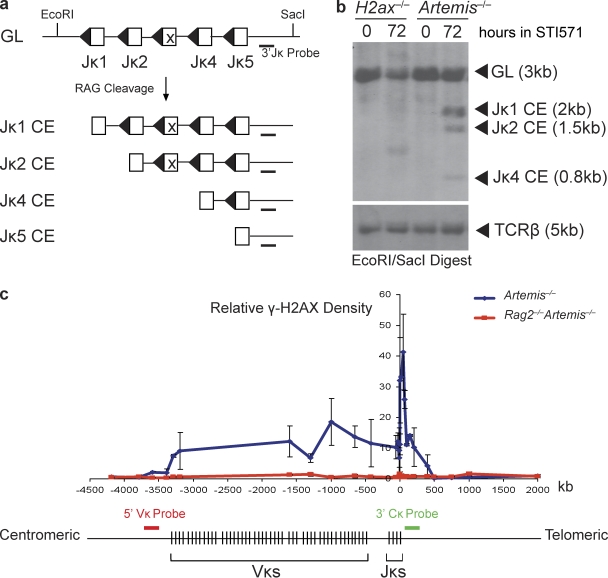
Figure 2.
No accumulation of Jκ coding ends in the absence of H2AX phosphorylation along RAG-cleaved Igκ DNA strands. (a) Shown are schematic diagrams of the Jκ cluster of the Igκ locus in the uncleaved (GL) and cleaved but not repaired (CE) configurations. Open boxes represent the Jκ segments and triangles their recombination signal sequences. Indicated are the relative positions of the EcoRI and SacI sites and 3′Jκ probe used for Southern blot analysis. (b) Southern blot analysis of recombination products generated in H2ax−/− and Artemis−/− abl pre–B cell lines, either untreated or treated with STI571 for 72 h. EcoRI–SacI-digested genomic DNA was hybridized with the 3′Jκ probe. The bands corresponding to Jκ loci of the GL and CE configurations are indicated. The STI571-treated H2ax−/− cells harbor a band that likely represents a predominant VκJκ rearrangement. Blots were stripped and then probed with a TCR-β probe as a control for DNA content. These data are representative of experiments performed >10 independent times. (c) Schematic diagram of the mouse Igκ locus and graphical representation of γ-H2AX densities as determined by ChIP at locations along DNA strands within and adjacent to Igκ in Artemis−/− abl pre–B cells treated with STI571 for 96 h. The 0-kb value of the x-axis corresponds to the 3′ end of the Jκ5 coding segment. The negative and positive values represent the distances centromeric and telomeric, respectively, from the 3′ end of Jκ5. Red and green bars indicate the approximate genomic locations to which the 5′ Vκ (RP24-243E11) and 3′ Cκ (RP23-341D5) BACs hybridize. The lengths of these bars are not drawn to scale. These data are representative of experiments performed >20 independent times. Error bars indicate standard deviation of three independent experiments.

