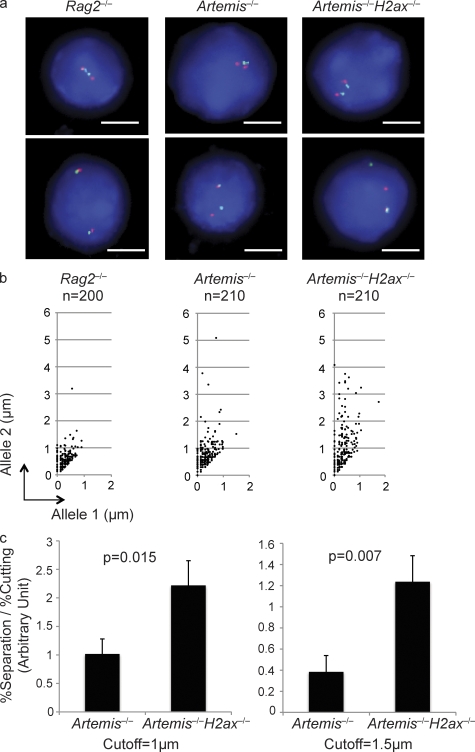
Figure 3.
H2AX suppresses separation of RAG-cleaved Igκ locus DNA strands. (a) Shown are representative fluorescent light microscopy images of 2C-FISH analysis conducted on G1-phase nuclei of Rag2−/−, Artemis−/−, and Artemis−/−H2ax−/− abl pre–B cells treated with STI571 for 96 h. Nuclei were hybridized with the 5′ Vκ (red) and 3′ Cκ (green) BACs and stained with DAPI to visualize DNA. The representative Rag2−/− image shows a nucleus with coincident probe hybridization signals on both Igκ alleles. The top nucleus contains paired Igκ alleles and the bottom unpaired Igκ alleles. The representative Artemis−/− and Artemis−/−H2ax−/− images each shows nuclei with coincident probe signals on both Igκ alleles and paired Igκ alleles (top) or noncoincident probe signals on one Igκ allele, overlapping probe hybridization on the other Igκ allele, and unpaired Igκ alleles (bottom). Bars, ∼3 µm. (b) Shown are representative scatter plots depicting the distances between red and green signals on allele 1 (shorter distance) and allele 2 (longer distance) in G1-phase nuclei of Rag2−/−, Artemis−/−, and Artemis−/−H2ax−/− abl pre–B cells treated with STI571 for 96 h. The numbers of nuclei assayed to generate the representative data are indicated. These data are representative of experiments performed three independent times. (c) Shown are bar graphs depicting in arbitrary units the nuclei with separated RAG-cleaved Igκ DNA strands normalized to the extent of cutting in three experiments conducted on cells of independent Artemis−/− and Artemis−/−H2ax−/− abl pre–B cells treated with STI571 for 96 h. To obtain these data, the percentage of nuclei with separated signals was divided by the percentage of RAG-cleaved Igκ alleles within the population of treated cells. The graphs use either 1 µm (left) or 1.5 µm (right) as the cutoff for distinction between coincident or overlapping versus noncoincident probe hybridization signals. The p-values for comparison between cells of different genotypes are indicated. These data were obtained from the same experiment performed three independent times. Error bars indicate standard deviation of three independent experiments.

