Figure 4.
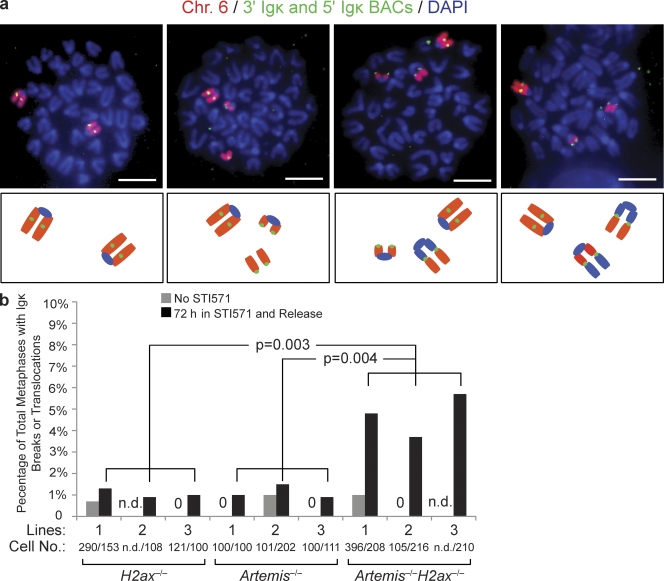
H2AX prevents transition of RAG-cleaved Igκ DNA strands into chromosome breaks and translocations during cellular proliferation. (a) Shown are representative fluorescent light microscopy images of whole chromosome (Chr.) 6 paints (red) and FISH analysis using the 5′ Vκ and 3′ Cκ BACs (both green) and DAPI (blue) to visualize DNA on metaphases prepared from STI571-treated and released Artemis−/−H2ax−/− abl pre–B cells. Below each image is a schematic representation of the observed chromosome 6 configurations. Images show from left to right: two intact chromosome 6; an intact chromosome 6 and a chromosome 6 with an Igκ locus break; an intact chromosome 6 and a chromosome 6 broken into two fragments with one resolved as an Igκ locus translocation; and an intact chromosome 6 and a broken chromosome 6 that resolved as two distinct Igκ locus translocations. Bars, ∼1 µm. (b) Shown is a bar graph with quantification of RAG-initiated Igκ chromosome breaks or translocations in metaphases prepared from cells of three independent H2ax−/−, Artemis−/−, and Artemis−/−H2ax−/− pre–B cell lines released from STI571 treatment. Metaphases prepared from cells of the same lines without STI571 treatment were assayed for Igκ chromosome breaks or translocations to control for potential spontaneous rearrangement and genomic instability accumulated during cell culture. The data represents the percentage of total metaphases analyzed that contained Igκ chromosome abnormalities. The numbers of metaphases assayed to generate the representative data are indicated. 0, Igκ abnormalities were not observed; n.d., not determined. The p-values for comparison between cells of the indicated different genotypes are shown. These data were obtained from the same experiment performed three independent times.

