Figure 5.
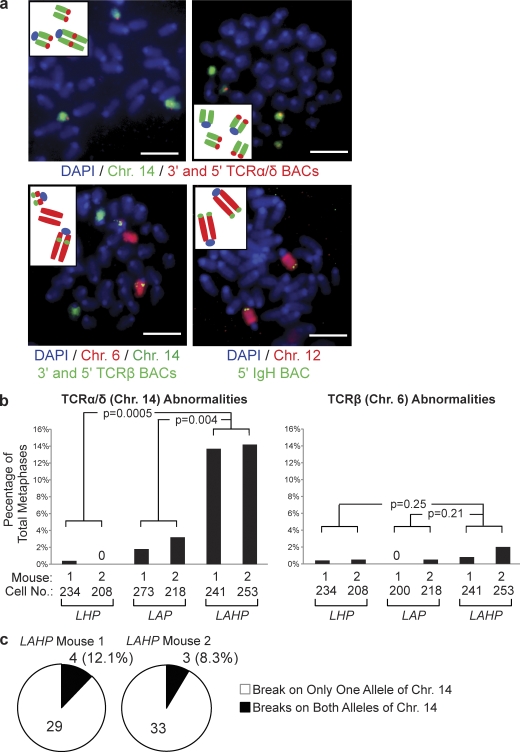
H2AX prevents chromosome breaks emanating from unrepaired TCR-α/δ locus coding ends in primary thymocytes. (a) Shown are representative fluorescent light microscopy images of whole chromosome paints and FISH analysis of antigen receptor loci on metaphases prepared from OP9 primary thymocytes. The insets contain schematics depicting the chromosome abnormalities within each metaphase. Chromosome 14 paints (green) and FISH with 5′ Vα and 3′ Cα BACs (both red) and DAPI (blue) to visualize DNA are shown in the top. Chromosome 6 paint (red) and FISH with 5′ Vβ and 3′ Cβ BACs (both green) and DAPI (blue) to visualize DNA are shown in the bottom left. Chromosome 12 paint (red) and FISH with a 5′ VH BAC (green) and DAPI (blue) to visualize DNA are shown in the bottom right. Bars, ∼ 2 µm. (b) Shown are bar graphs with quantification of chromosome abnormalities involving TCR-α/δ loci (left) or TCR-β loci (right) in metaphases prepared from primary thymocytes of two independent LHP, LAP, and LAHP mice. The numbers of metaphases assayed to generate the data are indicated. Values of 0 mean that no TCR abnormalities were observed. The p-values for comparison between cells of the indicated different genotypes are shown. These data were obtained from the same experiments performed two independent times. (c) Shown are pie charts depicting the percentages of LAHP cells with TCR-α/δ chromosome breaks that contain these abnormalities on either one (white) or both (black) allelic copies of chromosome 14.

