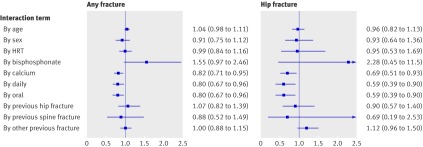
Fig 2 Interaction tests on logistic regression base model, 36 months intention to treat scenario. Each panel shows summary of 10 separate interaction analyses, testing statistical significance of each treatment by covariate interaction term added to base model. Coefficients differing significantly from 1.0 indicate presence of interaction (non-proportional hazards) between covariate and treatment; coefficients below 1.0 indicate greater treatment response (lower risk of fracture), and coefficients above 1.0 indicate smaller treatment response (higher risk of fracture). HRT=hormone replacement therapy

An official website of the United States government
Here's how you know
Official websites use .gov
A
.gov website belongs to an official
government organization in the United States.
Secure .gov websites use HTTPS
A lock (
) or https:// means you've safely
connected to the .gov website. Share sensitive
information only on official, secure websites.
