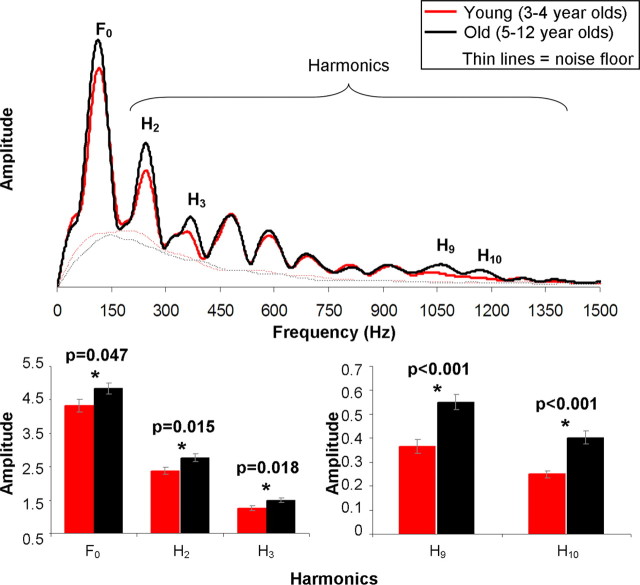
Figure 4.
Grand-averaged FFT for the young group (red) and old group (black). Thin lines represent the noise floors for each group. The young group showed significantly diminished magnitudes for the fundamental frequency (F0) and harmonics 2, 3, 9, and 10. Bar graphs represent mean and SE of significant regions for each group.

