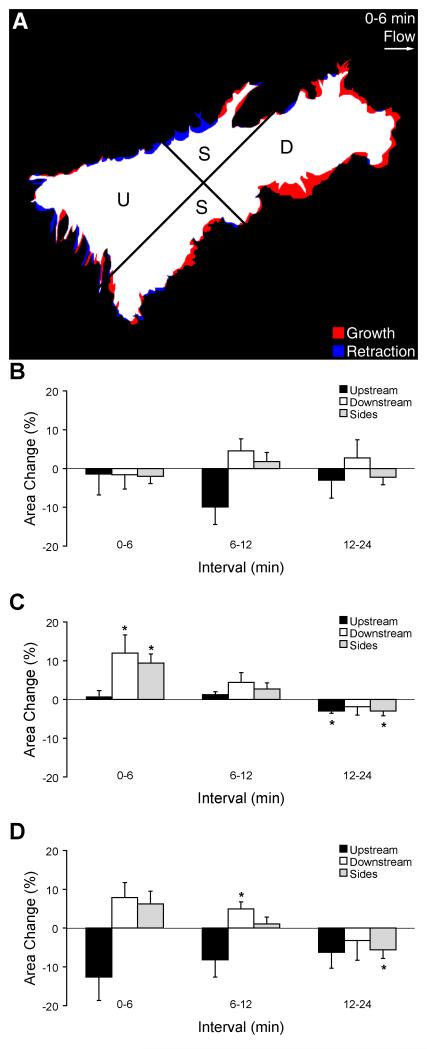
Figure 6.
Directionality of GFP-actin area change in a subconfluent EC layer. (A) Schematic overlay of GFP-actin images at the beginning and end of a 6-min interval after flow onset, illustrating area growth (red) and retraction (blue). White indicates areas that did not change in quadrants oriented upstream (U), downstream (D), or towards the sides (S) with respect to the flow direction. (B) Area changes (mean±SE) during consecutive 6-min intervals without flow. (C) Area changes during consecutive 6-min intervals after onset of unidirectional steady flow at t=0 min. (D) Area changes after onset of flow with medium containing cytochalasin D. *Significantly different than zero (p<0.05).

