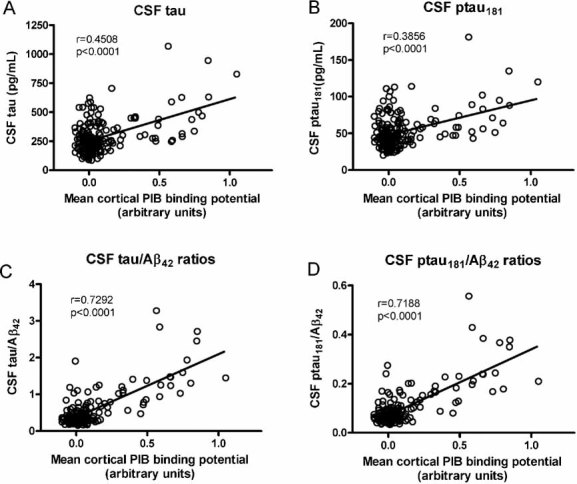
Figure 4. Cortical amyloid as detected by PET PIB and its relationship to CSF tau and ptau181 and the ratios of CSF tau/Aβ42 and ptau181/Aβ42 in CDR 0 participants (n = 189).

A linear relationship is observed between the amount of cortical amyloid and
- the levels of CSF tau
- the levels of CSF ptau181
- the ratios of CSF tau/Aβ42 and
- the ratios of the ptau181/Aβ42. The correlations between the CSF tau(s)/Aβ42 ratios and MCBP remain significant even when the statistical outlier (high PIB, high ratio) is omitted from the analysis (tau/Aβ42, r = 0.74227, p < 0.0001; ptau181/Aβ42, r = 0.73510, p < 0.0001). All Pearson correlation coefficients are corrected for age.
