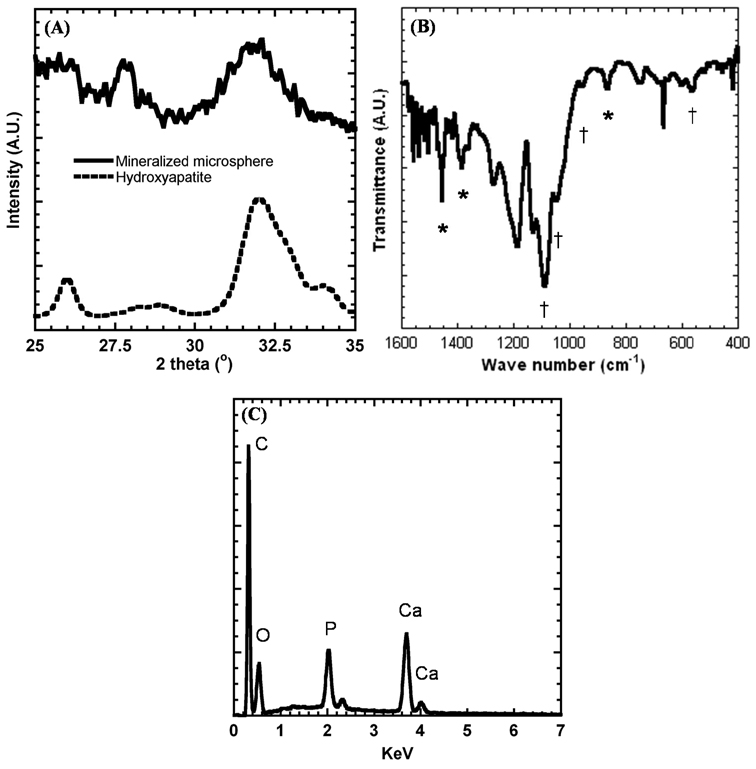
Figure 4.
(A) X-ray diffraction analysis of mineral-coated microspheres and hydroxyapatite powder (included for comparison), (B) Fourier transform infrared analysis of mineral-coated microspheres. Peaks associated with carbonate are denoted by *, and peaks associated with phosphate are denoted by †. (C) EDS spectrum of mineral-coated microspheres after a 7 day incubation in mSBF.

