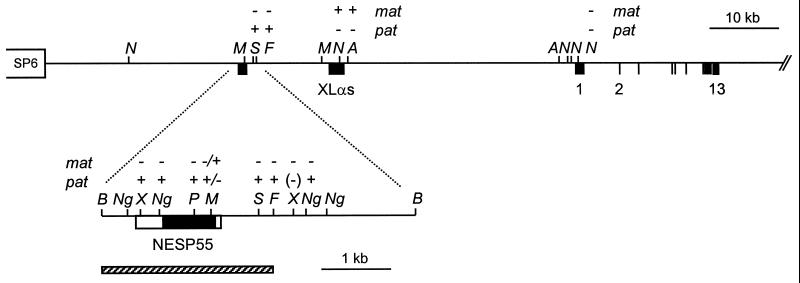
Figure 3.
Map (to scale) obtained from analysis of PAC clone 309f20. (Left) The SP6 end of the PAC insert. (Right) Exons 1–13 of GNAS1. Restriction sites whose methylation status has been examined are indicated above by − or + to indicate unmethylated or methylated status, respectively, on maternal and paternal alleles. (Upper) The large map is complete only for NotI (N) and AscI (A) sites. (Lower) On the expanded view, BglII (B), MluI (M), NgoMI (Ng), PvuI (P), SacII (S), FspI (F), and XhoI (X) sites are indicated. The hatched bar indicates the probe used in Southern blotting in the present study. The methylation indicated for the XLαs exon and exon 1 is as described (15).

