Fig. 2.
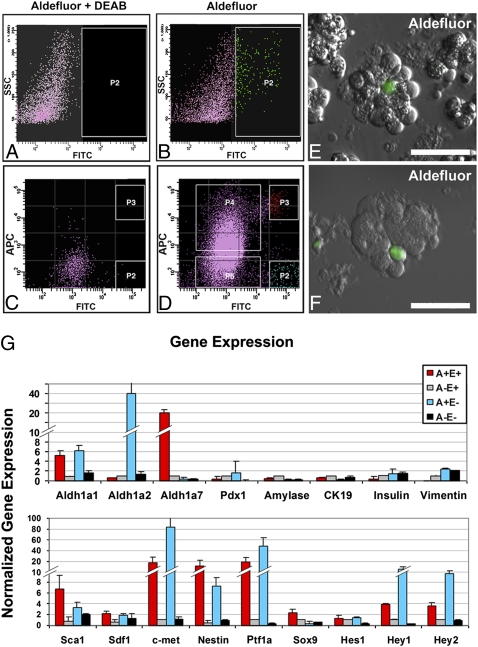
FACS isolation of ALDH1-expressing centroacinar/terminal ductal epithelial cells using the Aldefluor reagent. FACS sorting was performed on single cells isolated from peripheral acinar-ductal units depleted of endocrine and large duct elements. (A and B) Gating of Aldefluor-positive cells based on DEAB-sensitive ALDH1 enzymatic activity. y axis indicates side scatter; x axis indicates intensity of Aldefluor signal (A) with and (B) without DEAB. (B and C) Detection of ALDH1 enzymatic activity (C) with and (D) without DEAB, in conjunction with surface detection of E-cadherin protein. y axis represents intensity of labeling with APC-conjugated anti-E-cadherin antibody; x axis indicates intensity of Aldefluor signal. FACS-sorted populations indicated by P2, P3, P4, and P5 in D correspond to Aldefluor-positive, E-cadherin-negative (A+E−), Aldefluor-positive, E-cadherin-positive (A+E+), Aldefluor-negative, E-cadherin-positive (A−E+), and Aldefluor-negative, E-cadherin-negative (A−E−), respectively. (E and F) Imaging of collagenase-digested mouse pancreas using Aldefluor reagent confirms centroacinar/terminal ductal localization of Aldefluor-positive cells, similar to that observed for ALDH1 immunofluorescence (Figs. 1 and 2). Note centroacinar/terminal ductal position and small size of Aldefluor-positive cells relative to larger acinar cells, which are easily identifiable by granular cytoplasm corresponding to apical zymogen granules. (Scale bars: 50 μM.) (G) Quantitative RT-PCR analysis of gene expression in A+E+ cells (red), A+E− cells (white), A+E− cells (blue), and A−E− cells (black). Compared with A−E+ aldefluor-negative epithelial cells, A+E+ aldefluor-positive centroacinar/terminal ductal epithelial cells are enriched for transcripts encoding Aldh1a1, Aldh1a7, Sca1, Sdf1, c-Met, Nestin, Ptf1a, and Sox9. (Scale bars: 50 μM.)

