Fig. 1.
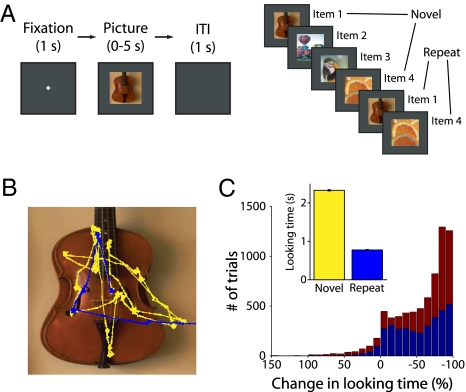
Behavioral task and performance. (A) VPLT design. Two-hundred novel stimuli were presented in each test session, with up to eight trials intervening between the first and second presentations. Each trial began with a required 1-s fixation period and trials were separated by a 1-s intertrial interval. (B) An example of the monkey’s scan path over the first (yellow) and second (blue) presentations of a stimulus. The monkey spent much less time viewing the stimulus in the second presentation. (C) Combined behavioral data from 45 test sessions in two monkeys. Histogram depicts the change in looking time for all stimuli as a percentage of the amount of time the monkey spent looking at the first presentation of each stimulus (blue: Monkey A; red: Monkey B). A negative change represents stimuli for which looking times were longer during the first presentation. For clarity, trials with a percent-change in looking time of greater than 150% are not shown (these represented a total of 5 trials, or 0.2 trials per session, for Monkey A and 22 trials, or 1.1 trials per session, for Monkey B). (Inset) Mean looking time for first and second presentations of all stimuli. There was a significant (P < 0.001) decrease in looking time for the repeated presentation. Error bars represent SEM.

