Fig. 4.
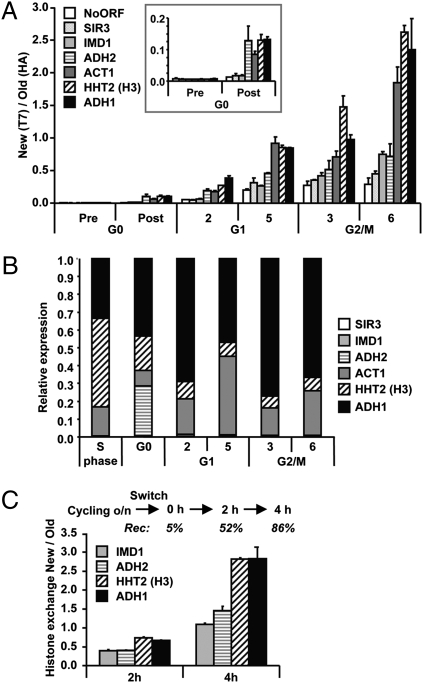
Replication-independent transcription-coupled histone turnover quantified by affinity purification. (A) Analysis of chromatin-bound histones by ChIP of HA (old) and T7 (new) histone H3 quantified by real-time quantitative PCR (qPCR). Histone exchange (ratio of new/old) was determined for promoters of the indicated genes and an intergenic region on chromosome V (NoORF). The genes are ranked by estimated transcription frequency in log phase, from low (open bars) to high (solid bars) frequency. The result shown is the average of two individual experiments (± SEM). The Inset is a zoom-in of the G0 time points. (B) Relative mRNA expression levels were determined by reverse-transcriptase qPCR (RT-qPCR). An S-phase sample of the same H3-RITE strain was used as a reference sample. A wild-type strain without a RITE tag showed very similar expression profiles (Fig. S4). (C) Histone turnover in H3-T7→HA cells without any arrest was determined by induction of Cre-recombinase in log-phase cells (OD660 = 0.25). The percentage of cells that had undergone recombination (Rec) is indicated for each time point (determined by a colony-plating assay). Histone replacement at promoters was determined by ChIP (HA/T7).

