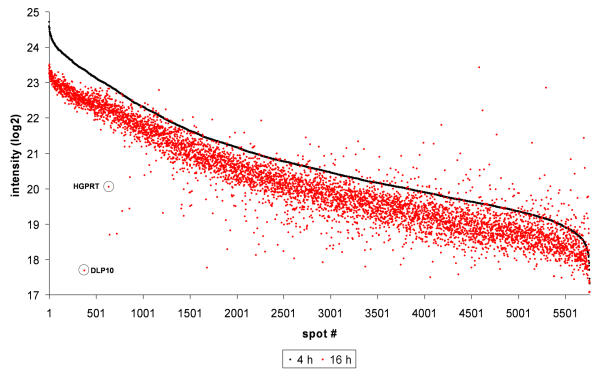
Figure 4.
Hybridization signals with aRNA from different amplification times. Scatterplot of signal intensities (5760 features) from the hybridization with 4 h and 16 h amplified aRNA. The signals from the 4 h time-point were plotted in order of decreasing intensity (black) with the correspoding genes from the 16 h timepoint (red). The two transcripts (DLP10 and HGPRT) described further are marked in circles.

