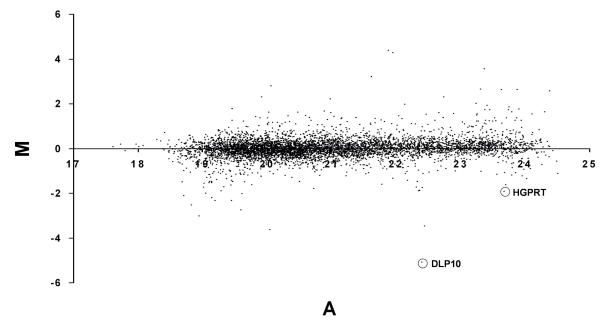
Figure 7.
Scatterplot of log-ratios from the hybridization signals of 4 and 16 hour amplified aRNA. Ratios are displayed as a log2-based MA-Plot according to [14] and were transformed by locally weighted regression [22]. Spots in circles are examples of the two transcripts (DLP10 and HGPRT) which undergo strong time-dependent degradation.

