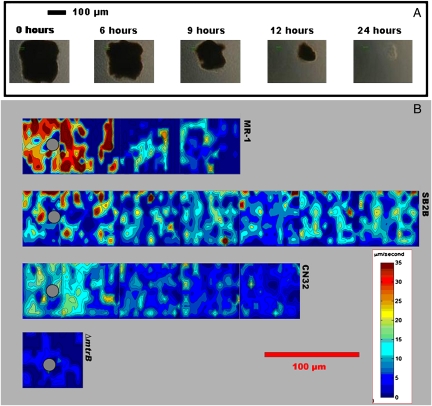
Fig. 1.
Video microscopy photographs and motility analysis during bacterial reduction of MnO2 particles. (A) Five frames from video data at 40× show the progressive reduction of a large (≈180 μm diameter) MnO2 particle over the course of 24 h. Frames are displayed from initial (Left) to 24 h (Right) at denoted time intervals (0, 6, 9, 12, and 24 h). (B) Four contour plots of bacterial average velocity around similar-sized MnO2 particles (Left Center), as calculated by our image analysis algorithm. The four representative experiments were conducted with strains S. oneidensis MR-1, S. amazonensis SB2B, S. putrefaciens CN32, and S. oneidensis MR-1 ΔmtrB, which are displayed from top to bottom in panoramic strips. These plots illustrate the correlation between motility near a MnO2 particle and reduction of the particle. MR-1 and SB2B both reduced MnO2 particles at a rapid pace (<24 h), whereas CN32 reduced at a much slower pace (>24 h) and the ΔmtrB mutant did not reduce at all. A number of 30-sec video clips are assembled in the panoramic strips. The contour maps show regions of high bacteria traffic (red) around the MnO2 particles (denoted with gray circle).

