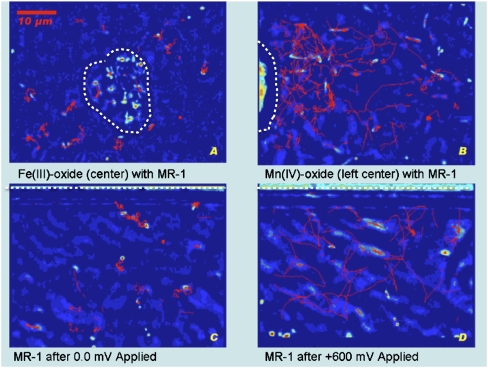
Fig. 2.
Bacterial trajectories. Tracking trajectories (red lines) for S. oneidensis MR-1 cells during 10-sec video samples captured using 100× magnification. In all four experiments the bacteria are using 20 mM lactate as their carbon source. The strains were captured on video while sealed in anaerobic capillary tubes. (A) An Fe(OH)3 particle (located in the center of the frame) elicited considerably less motility response than an MnO2 particle (located left center) (B) where cells were observed swimming at speeds of 40–80 μm/sec. Touch-and-go behavior, in which the bacteria briefly contact the metal oxide surface, was observed for the next 2 h (Movie S1). (C) Trajectory diagram for 10 sec of video at 100× magnification adjacent to the working electrode. Video captured after MR-1 was exposed to 10 min at 0 mV vs. graphite reference electrode. (D) Video captured after MR-1 was exposed to 10 min at +600 mV. Swimming increased immediately (1−30 sec) after the voltage was applied, then continued to increase over the next 20 min. At 0 mV or any relatively lower voltage the motility activity decreased but returned when +600 mV was reapplied (Movie S6). Approximate boundaries of the mineral particles and the location of the graphite electrodes are shown by dashed white lines.

