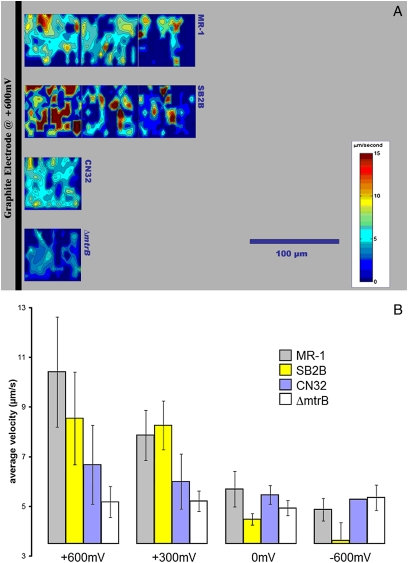
Fig. 3.
Contour plots showing motility response of MR-1, SB2B, and CN32 strains, and the MR-1 ∆mtrB mutant to potentials applied to the working electrode in a microelectrochemical cell. (A) The digital contour plots show the average velocity near an electrode with applied potential (+600 mV) that mimics an electron-accepting surface like the anode of an MFC. The x and y axes correspond to horizontal and vertical screen positions from a number of 30-sec video clips, which are assembled in panoramic strips. The black bar on the left represents the location of the graphite electrode filament relative to each frame. These plots show results from four experiments with strains MR-1, SB2B, CN32, and ΔmtrB, which are displayed respectively from top to bottom in panoramic strips. The contour map shows regions of high bacterial velocity (red) and low velocity (blue). During the application of three positive potentials (+600, +300, and +150 mV) the wild-type bacteria responded with excited swimming near the electrode surface. (B) Average velocity values for the bacterial strains responding with 10 min of exposure to four different voltages (potentials) applied to the working electrode (+600 mV, +300 mV, 0 mV, and −600 mV). The graph compares wild types (MR-1, SB2B, and CN32) with the cytochrome deletion mutant, ΔmtrB, at each applied potential. The ΔmtrB mutant showed no swimming response throughout the range of positive and negative voltages. The swimming response of CN32 to small positive electric fields was relatively less than the responses of SB2B and MR-1. MR-1 and SB2B are considered to be good current-producing bacteria for an analogous MFC system. Error bars represent 2× standard deviation.

