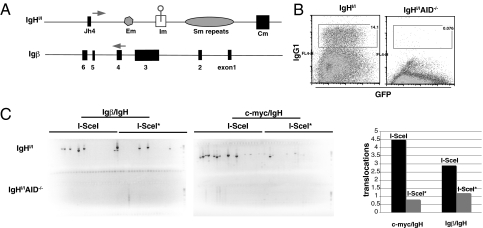
Fig. 4.
Igβ/IgH translocations. (A) Schematic representation of Igβ and IgH locus showing the position of the primers used to detect Igβ/IgH translocations. (B) Flow cytometric analysis of CSR to IgG1 from IgHI/I and IgHI/I AID−/− B cells stimulated with LPS and IL4 and infected with a retrovirus carrying I-SceI or I-SceI* and GFP as a marker (26). GFP+ cells were sorted and analyzed for translocations. (C) Translocations by retroviral I-SceI or I-SceI*, which is an inactive mutant form of the enzyme. Ethidium bromide-stained agarose gels with PCR products corresponding to Igβ/IgH and c-myc/IgH translocations as verified by sequencing. Graph represents the comparison of translocation frequencies from two independent experiments in which a total of 10 million cells were assayed.

