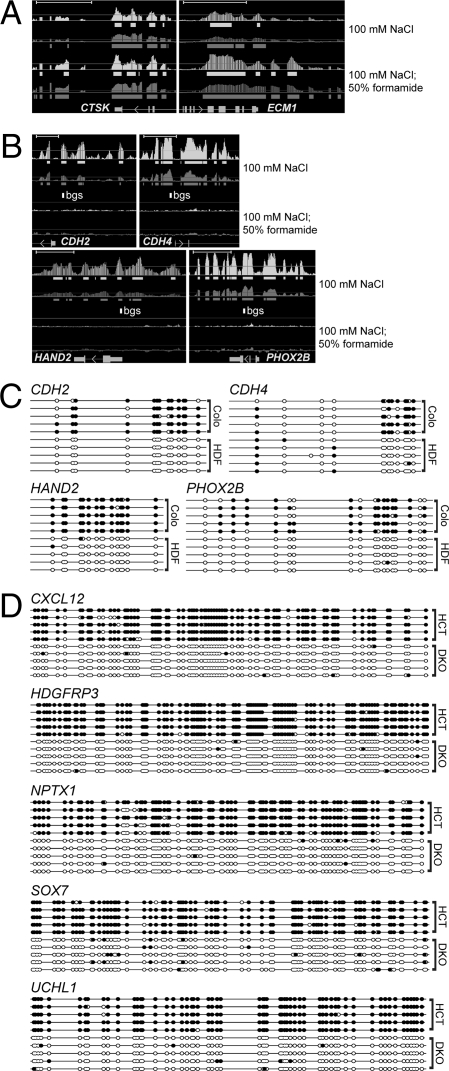
Fig. 2.
Identification of differentially methylated genomic regions by denaturation. (A and B) Tiling array analysis of GAPF-positive regions in Colo320DM (Colo) cells compared to primary skin fibroblasts (HDF). The Upper pair of graphs is from the original GAPF method (100 mM NaCl) and the Lower pair is GAPF with the addition of formamide (100 mM NaCl, 50% formamide). Graphically displayed are P values (−10 log10, light shading) and signal [log2(signal ratio), dark shading], and the solid bars below each graph depict (−10 log10) P values >40 (= P < 0.001) and log2(signal ratio) > 1.5, where Colo > HDF. Gene names and mRNA structures (exon, large rectangle; intron, thin line; UTR, small rectangle; arrow, direction of transcription) are shown at the bottom of each panel. (Scale bars, ∼5 kb.) (A) The palindromes at CTSK and ECM1 are identified by the original GAPF assay and enhanced by the addition of 50% formamide. (B) Nonpalindromic loci showing a positive signal with the original GAPF assay that disappear with the addition of 50% formamide. The open rectangle labeled bgs depicts the area subjected to bisulfite genomic sequence analysis shown in C. (C) Bisulfite DNA sequence analysis of the nonpalindromic loci in B shows dense CpG methylation in Colo compared to HDF. Solid circles represent CpG methylation, and open circles depict unmodified CpG dinucleotides. (D) Bisulfite sequence analysis of DAMD-positive loci in HCT116 cells shows heavy CpG DNA methylation. Individual clones are shown for HCT116 (HCT) and DKO.

