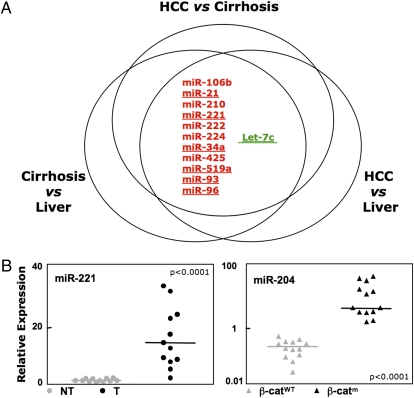
Fig. 2.
miRNA signatures in HCC. (A) Intersection of SAM analysis for three profiles. The intersection is shown among the deregulated miRNAs in the three classes of tissues: HCC, cirrhosis, and normal liver. Only the miRNA deregulated also in the HCC cell lines were considered. Red, up-regulated miRNAs; green, down-regulated miRNAs. (B) Validation of microarray by qPCR of differentially expressed miRNAs in nontumoral (NT) vs. tumoral (T) liver tissues and β-catenin mutated (β-catm) vs. wild-type (β-catwt) specimens. The relative expression fold of each miRNA is normalized to RNU6B and miR-140. P values were obtained by using a two-sided Student t test.

