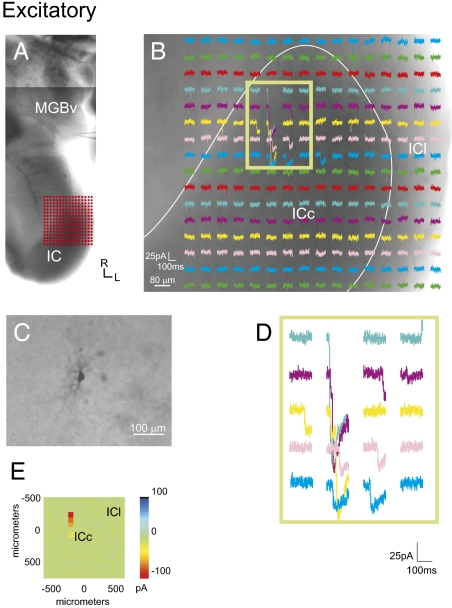
Fig. 2.
Photostimulation of the IC elicits excitatory responses in the MGB. (A) Recording locations in the MGB and the photostimulation sites in the IC, as shown in a photomontage of the slice. Grid of 16 × 16 dots indicates the stimulation sites as depicted in B. (B) Photostimulation response map in the IC. Each trace depicts the response of the recorded MGB neuron to photostimulation at each IC site. (C) Recorded bitufted MGB neuron labeled with biocytin. (D) Higher magnification traces of boxed region. (E) Mean amplitude of photostimulation responses. (Scale bars: B, 80 μm; C, 100 μm.)

