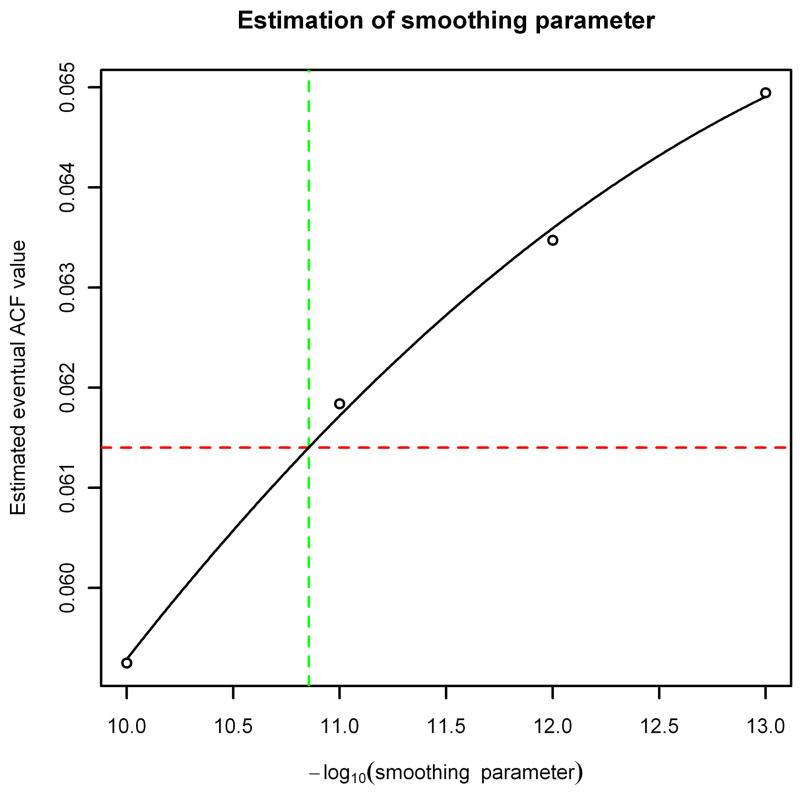
Figure 3.
Value of Var(b)/Var(y) for baselines estimated from the noise spectrum in Figure 2 using various choices of smoothing parameter . The solid line is the least-squares fit parabola for the data points, and the horizontal dashed line is the eventual value of the ACF of the spectrum.

