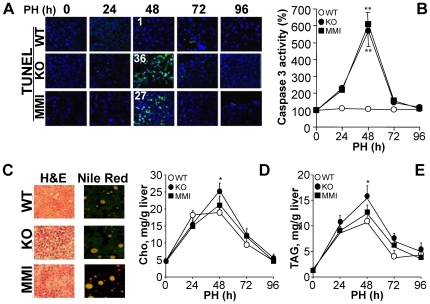
Figure 3. TRβ inhibits apoptosis in regenerating liver.
(A) TUNEL staining of cells undergoing apoptosis in regenerating liver (green). Liver sections were obtained at the indicated times after PH. The mean (n = 5 sections) of TUNEL positive cells per 100 nuclei (blue; TO-PRO-3 staining) is given at 48 h. (B) Caspase 3 activity was determined fluorometrically in liver extracts obtained at the indicated times after PH, and expressed vs. the activity of sham samples at 0h. (C) Alternatively, liver sections were stained with eosin/hematoxylin or Nile red to visualize lipid bodies. (D,E) Intrahepatic levels of cholesterol and triglycerides determined in liver extracts obtained at the indicated times after PH. Results show means ± SD of 6 animals per condition (B,D,E) or sections from a representative experiment of three (A,C). *P<0.05 vs. the WT condition.

