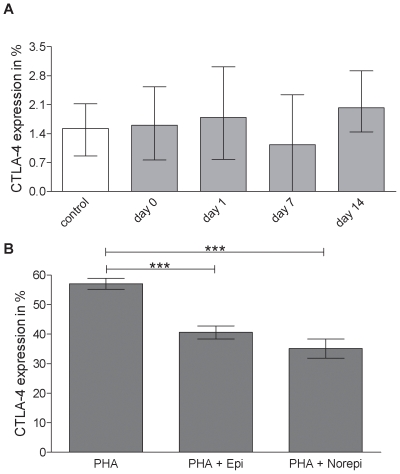
Figure 4. Lack of CTLA-4 expression and inhibition by catecholamines.
A) The percentage of PBMC expressing CTLA-4 is undistinguishable between healthy controls (white bars) and stroke patients (grey bars) in the first two weeks following stroke. Medians and interquartile ranges. n = 9; 31; 33; 27; 20; (control; day 0; day 1; day 7; day14). B) Percentage of CTLA-4 expression on PBMC decreases after in vitro treatment with PHA+epinephrine or PHA+norepinephrine compared to treatment with PHA alone. *** p<0.001. Medians and interquartile ranges. .n = 13; 6; 9; (PHA; PHA+Epi; PHA+Norepi).

