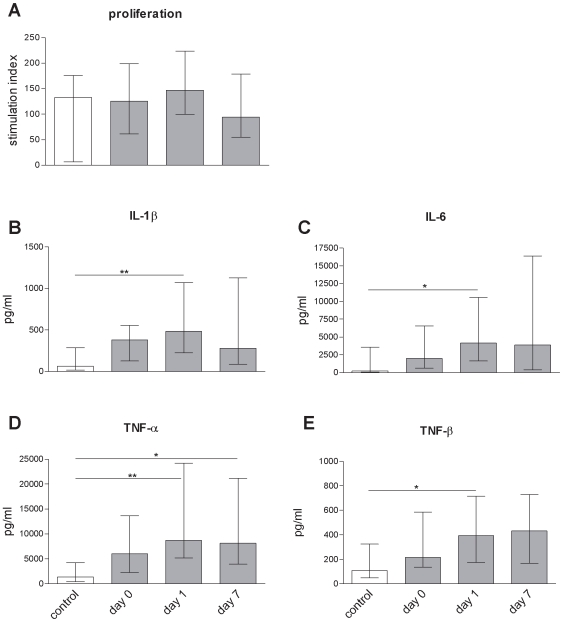
Figure 5. Surviving T lymphocytes are functional.
A) The proliferation expressed as stimulation index of T cells after ex vivo stimulation with PHA reveals normal proliferative responses of stroke patients (grey bars) lymphocytes compared to healthy controls (white bars) in the first week following stroke. Medians and interquartile ranges. n = 7; 36; 35; 32; (control; day 0; day 1; day 7). B–E) Ex vivo stimulation of T cells with PHA leads to increased proinflammatory cytokine release in supernatants of stroke patients cells (grey bars) compared to healthy controls (white bars) within the first week following stroke. * p<0.05; ** p<0.01. Medians and interquartile ranges. n(IL-1β, IL-6, TNFα, TNF-β) = 10; 37; 36; 28; (control; day 0; day 1; day 7).

