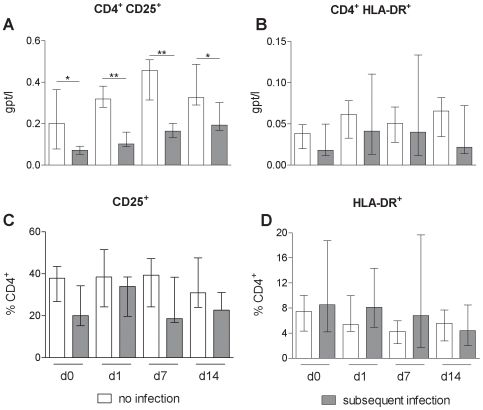
Figure 6. Relative proportion of activated T cells were undistinguishable between patient subgroups.
Activation markers on lymphocytes from stroke patients without subsequent infection (white bars) remained undistinguishable from those of stroke patients with subsequent infection (grey bars) within the relative proportion of lymphocytes in the first two weeks following stroke. * p<0.05; ** p<0.01. Medians and interquartile ranges. . n(CD4 + CD25 + , CD25 + %CD4 + ) = 5; 7; 7; 7; 7; 6; 6; 3; n(CD4 + HLA-DR + , HLA-DR + %CD4 + ) = 14; 12; 16; 11; 12; 9; 8; 5 (no infection day 0; subsequent infection day 0; no infection day 1; subsequent infection day 1; no infection day 7; subsequent infection day 7; no infection day 14; subsequent infection day 14).

