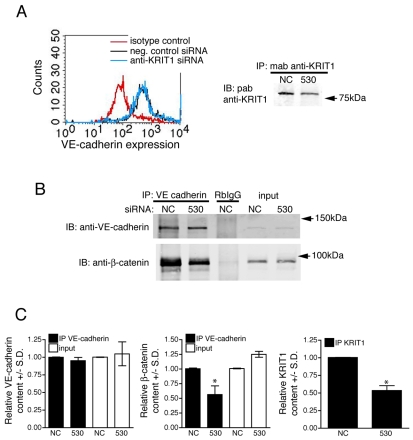
Fig. 1.
Loss of KRIT1 reduces β-catenin association with VE-cadherin. (A) Depletion of KRIT1 does not reduce the surface expression of VE-cadherin. Staining of the extracellular domain of VE-cadherin was compared with isotype control staining (red line) by FACS analysis of negative control small interfering RNA (siRNA)-transfected cells (black line) or anti-KRIT1 siRNA-transfected cells (blue line). Histograms are representative, n=3. Knockdown of KRIT1 was confirmed by western blot (right panel) in cells used for FACS analysis and co-immunoprecipitation. NC, negative control siRNA; 530, anti-KRIT1 siRNA; IP, immunoprecipitation; IB, immunoblot; mab, monoclonal antibody; pab, polyclonal antibody. n=3 separate determinations. (B) β-Catenin co-immunoprecipitates with VE-cadherin in cells expressing negative control siRNA or untreated cells (not shown); this association is diminished in cells expressing anti-KRIT1 siRNA. RbIgG, rabbit IgG. Blots are representative, n=3. (C) Densitometric quantification of co-immunoprecipitation western blots. Data shown are the relative expression of VE-cadherin and β-catenin in both immunoprecipitation (IP) and input samples, normalized to negative control siRNA expressing cells ± standard deviation (S.D.). *P<0.001 by Student’s t-test, n=3. The far right panel shows quantification of KRIT1 expression in these experiments ±S.D. *P<0.001 by Student’s t-test, n=3.

