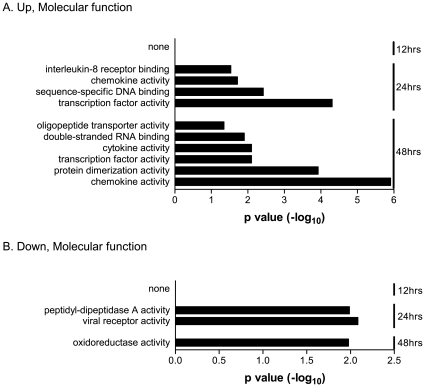
Figure 4. Enriched molecular functions of those genes whose expressions in 2B4 cells were significantly altered by SARS-CoV.
Expressions of both up- and down-regulated genes at 12, 24, and/or 48 hrs after SARS-CoV infection were analyzed against the entire human genome gene set. The enriched GO-annotated terms identified for those up-regulated and down-regulated genes are presented in A and B, respectively. The height of an individual bar represents the level of the statistical significance of the enriched GO-annotated term. An adjusted p value of <0.05 was used as the criterion for selecting enriched molecular functions.

