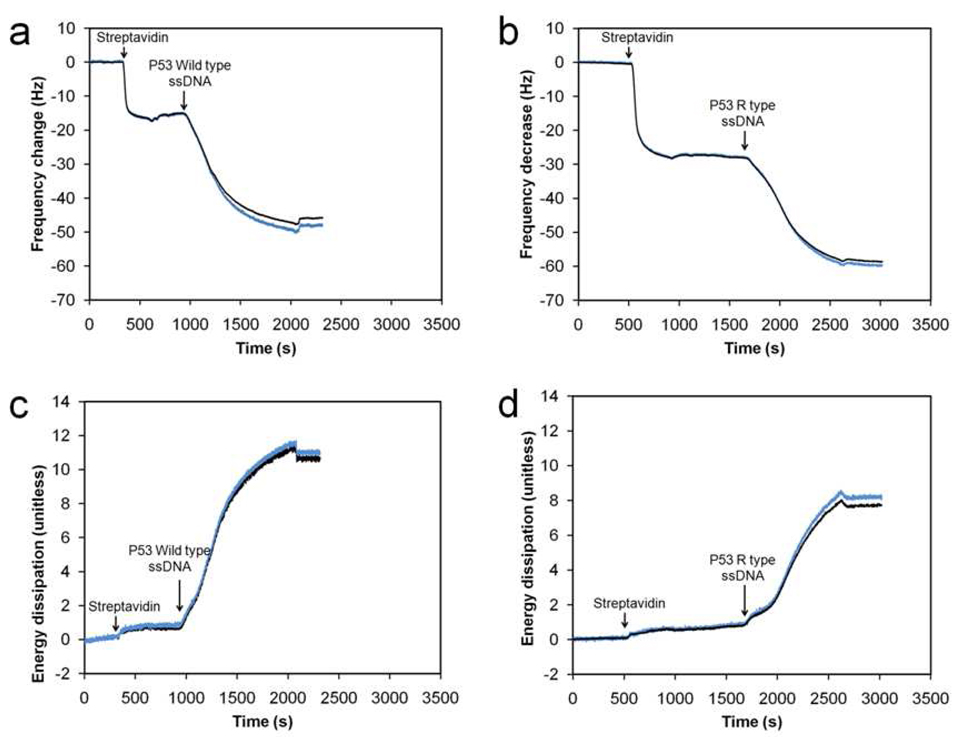
FIGURE 2.
Plot of raw (blue curve) and fitted (black curve) data for a typical frequency response and energy dissipation of the resonator at its fifth harmonic resonance as a function of time during the immobilization of the streptavidin layer and the ssDNA film. (a) Frequency response plot for the wild type sample. (b) Frequency response plot for the mutant type sample. (c) Energy dissipation plot for the wild type sample. (d) Energy dissipation plot for the mutant type sample.

