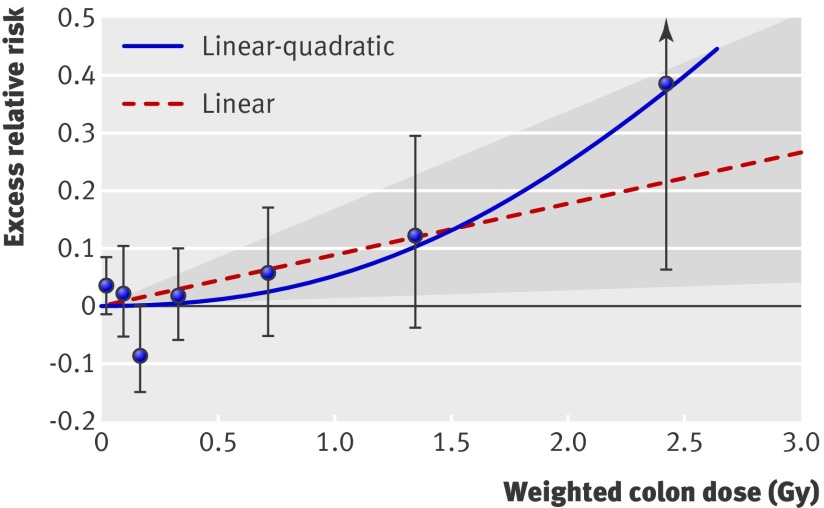
Fig 1 Radiation dose-response relation (excess relative risk per Gy) for death from stroke, showing linear and linear-quadratic functions. Shaded area is 95% confidence region for fitted linear line. Vertical lines are 95% confidence intervals for specific dose category risks. Point estimates of risk for each dose category are indicated by circles

An official website of the United States government
Here's how you know
Official websites use .gov
A
.gov website belongs to an official
government organization in the United States.
Secure .gov websites use HTTPS
A lock (
) or https:// means you've safely
connected to the .gov website. Share sensitive
information only on official, secure websites.
