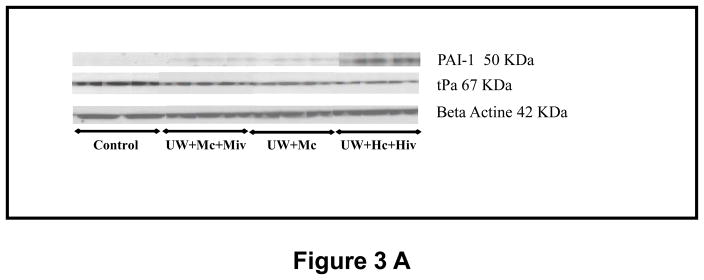
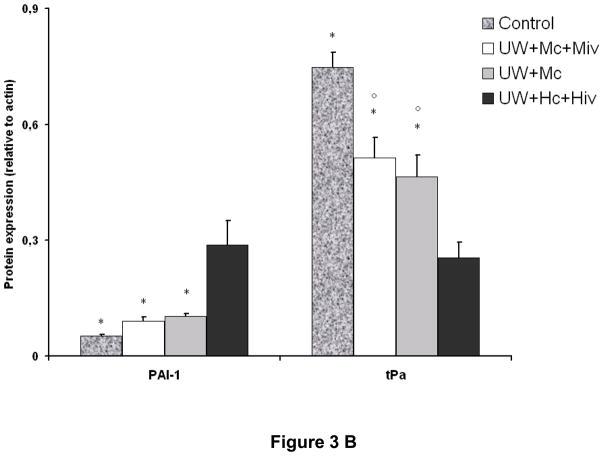
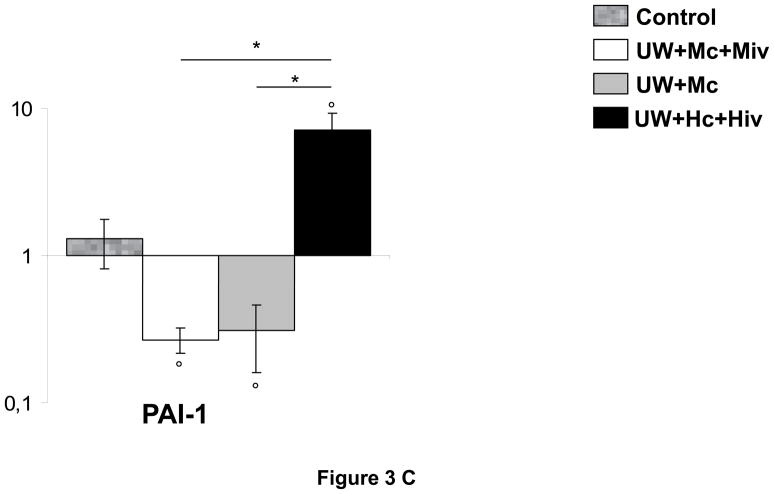
Figure 3. mRNA and protein expression of tPA and PAI-1 in transplanted kidneys, 3 months post transplantation.
A: representative blots for each antibody used in the four surviving groups. B: Quantitative analysis by densitometry of blots, shown are mean±SEM, Statistics: * p<0.05 versus UW+Hc+Hiv; ° p<0.05 versus Control; n=2–5. C: Quantitative Real Time PCR analysis of PAI-1 expression normalized to Control. Shown are mean±SEM, Statistics to Control: °:p<0.05. Statistics inter group: *:p<0.05. n=3–5.


