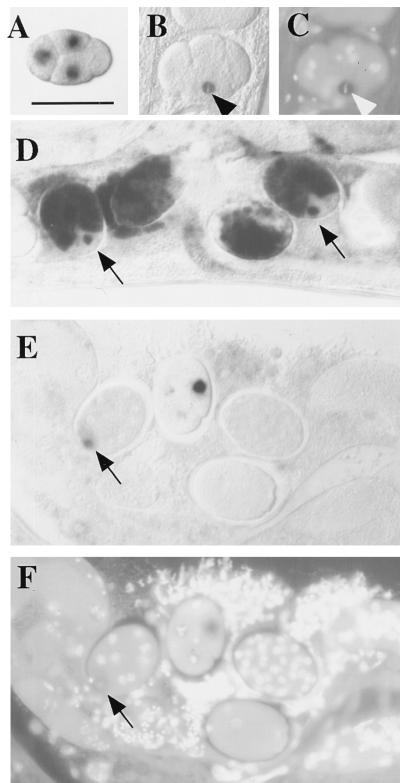
Figure 2.
Analysis of target RNA distribution in RNAi-treated embryos. Embryos shown are from an integrated (homozygous) transgenic line carrying a pes-10∷gfp fusion. The pattern of RNA products was analyzed by whole-mount in situ hybridization, with and without prior injection of dsRNA covering the 5′ half of the gfp coding region. (A) Control (uninjected) 4-cell embryo showing transcripts of a pes-10∷gfp translational fusion as they first accumulate in the nuclei of the 3 somatic blastomeres of the 4-cell embryo (anterior at left; dorsal at top). This corresponds to the pattern of pes-10 expression described by Seydoux et al. (15). [Bar = 50 μm (for all panels).] (B) An equivalent embryo after injection of dsRNA targeting gfp. Transcripts are still present in the nucleus of cells that have recently commenced transgene expression. As shown in this figure, a relatively strong signal was often detected in the EMS blastomere (arrowhead) of the 4- to 6-cell stage embryo, even while undergoing early stages of mitosis. These transcripts generally do not accumulate to the same levels observed in untreated embryos. (C) Image of embryo in B stained with the DNA-binding dye 4′,6-diamidino-2-phenylindole (DAPI), showing EMS in metaphase (arrowhead). (D) Untreated embryos. Transcripts are eventually transported out of the nucleus and accumulate in the cytoplasm. Nascent transcripts continue to be detected in later emerging somatic blastomeres (arrows). (E) RNAi-treated embryos of stages similar to those depicted in D. Whereas nascent transcripts from a recently emerging somatic blastomere are detected (arrow), transcripts do not accumulate to high levels and are never detected in the cytoplasm. (F) Image of DAPI-stained embryos shown in E. Images of in situ results were obtained with Nomarski differential interference contrast (DIC) microscopy; images of DAPI-stained embryos were obtained with epifluorescence microscopy.

