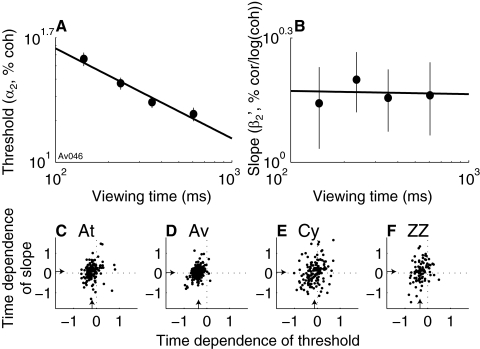
Fig. 4.
Summary of the effects of viewing time on behavior. A: log–log plot of threshold vs. viewing time from an individual session for monkey Av. Points and error bars are best-fitting values and SE, respectively, of α1 from Eq. 1 fit to time-binned data. Line is a weighted linear fit (slope [95% CIs] = −0.65 [−0.83 −0.47]). B: log–log plot of slope vs. viewing time from the same session. Points and error bars are best-fitting values and SE, respectively, of β1 from Eqs. 1 and 5 fit to time-binned data. Line is a weighted linear fit (slope [95% CIs] = −0.01 [−0.16 0.14]). C–F: summary of the time dependence of psychometric threshold and slope for the 4 monkeys, as indicated. Each point represents data from one session. Abscissa is the slope of the linear fit to loge (α1) vs. loge (viewing time), as in A. Negative values imply threshold decreased with increasing viewing time. Ordinate is the slope of the linear fit to loge(β1) vs. loge (viewing time), as in B. Negative values imply slope decreased with increasing viewing time. Arrows indicate medians.

