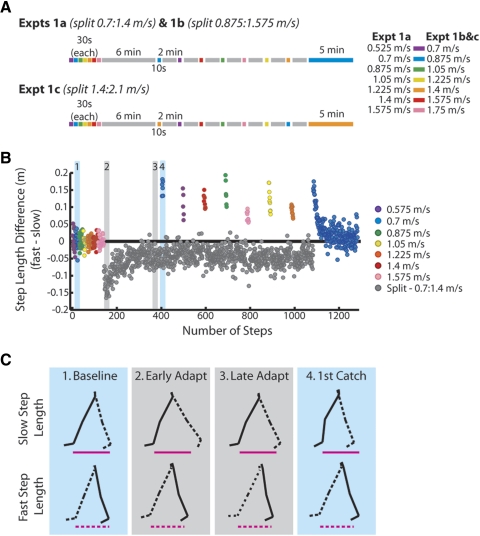
Fig. 2.
A: experimental protocol: tied-belt trials are in different colors (see legend for exact speeds) and split-belt trials are in gray. All experiments started with baseline tied-belt trials, followed by a 6-min adaptation period and alternating tied-belt catch trials (10 s) and split-belt re-adaptation periods (2 min). The order of catch trials was randomized with the exception of the 1st, which was always at the speed of the slow belt. Split-belt speeds for experiment 1a were 0.7:1.4 m/s, 1b were 0.875:1.575 m/s, and 1c were 1.4:2.1 m/s. The experiment ended with 5 min of tied-belt walking at the slow speed (i.e., the “wash-out”), and the size of the aftereffect at the beginning of this trial was compared with the 1st catch to ensure the stability of the catch trials throughout the experiment. B: single subject data from experiment 1a. Each dot represents 1 step; colored and gray dots correspond to tied- and split-belt trials, respectively. A step length difference of 0 indicates symmetry. Note that the catch trials vary in size according to the speed, and the asymmetry at the beginning of the final wash-out period was similar to the size to the 1st catch trial. Shaded regions marked with numbers 1–4 are highlighted in C. C: slow and fast step lengths during baseline (1), adaptation (2 and 3), and the 1st catch trial (4). The leg on the slow belt (“slow leg”) is shown in solid lines; the fast leg is shown in dashed lines. For reference, slow and fast step lengths at baseline are denoted by magenta lines below stick figures in all 4 conditions. Step length asymmetry in early adaptation was mainly due to a longer step on the slow side. After 6 min of adaptation, step lengths were equalized. The aftereffect in the 1st catch showed the opposite asymmetry as in early adaptation: the slow step was shortened and the fast step was lengthened.

