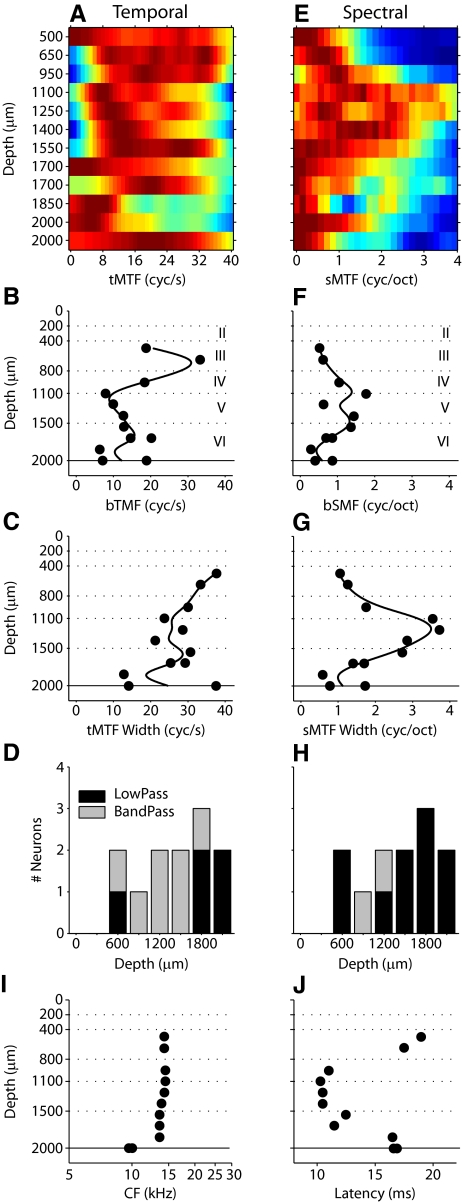
Fig. 4.
MTF profiles for the neurons in Fig. 3. Temporal (left column) and spectral (right column) MTFs and properties. First row (A, E) shows MTFs ordered by position. Second row (B, F) shows best temporal modulation frequency (bTMF). Third row (C, G) shows MTF width. Fourth row (D, H) shows MTF shape. I: characteristic frequency (CF) profile for the penetration. CF is relatively constant for cells in layers II–V. J: latency profile for the penetration. Latency is minimal at middle depths and increases at more superficial and deeper positions.

