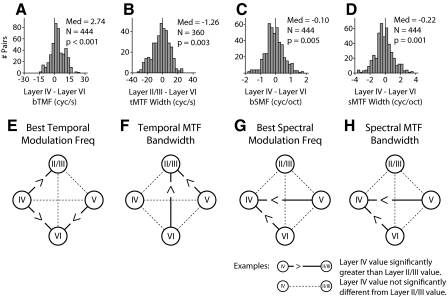
Fig. 6.
Global laminar variations of MTF parameters. The top row shows example difference histograms that were used to determine whether layer parameter differences were significant. The bottom row shows schematics for bTMF and MTF width. Each schematic describes whether values in one layer were different from values in other layers. Each circle represents a separate layer. Solid lines between layers indicate the parameters were significantly different. Dashed lines indicate that the values were not significantly different. A: example difference histogram used to compare layer IV and layer VI bTMF. To compare the parameter values in different layers the MTF parameters in one layer in a penetration were subtracted from those in the other layer. The differences were pooled across penetrations and Wilcoxon signed-rank tests were performed. The analysis was performed on all possible layer combinations. B–D: example difference histograms for tMTF width, bSMF, and sMTF width. E: layer IV bTMF values are greater than those in layers II/III and VI. Layer II/III and V values are also greater than those in layer VI for bTMF. F: tMTF width. G: bSMF. H: sMTF width.

