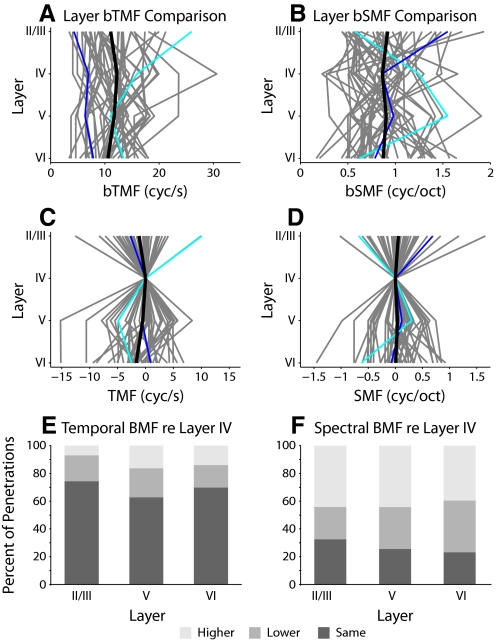
Fig. 8.
Best modulation frequency (BMF) trajectories in AI. Trajectories for all penetrations are shown. A: bTMF trajectories. B: bSMF trajectories. The value in each layer was obtained by taking the mean of BMFs of the recorded neurons in that layer. Each gray curve represents the trajectory of modulation information for one penetration. The black curve represents the mean layer values across all penetrations (n = 43; cyan: penetration in Fig. 4; blue: penetration in Fig. 5). C and D: trajectories as deviations from layer IV BMF values. E and F: BMF changes with respect to layer IV. The SD of layer IV BMFs was calculated. For each penetration, if a BMF in another layer differed by 1SD from the layer IV value, it was denoted as either higher or lower. E: in the majority of penetrations, bTMFs were similar in different layers. F: bSMFs were variable across layer, with many layers having higher bSMFs than layer IV.

