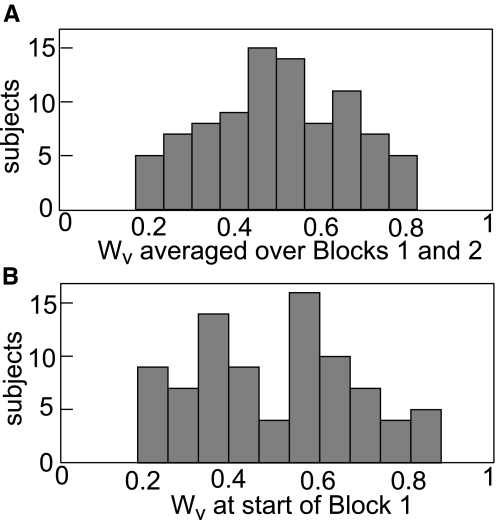
Fig. 4.
Distribution of Wv for subjects across all manipulations. A: histogram of subjects' weightings for the whole experiment (mean of all the Wv in Blocks 1 and 2). n = 89, mean = 0.49. Because every experiment consists of both a BadP block and a BadV block, the average of all Wv in both blocks should reveal any systematic preference for vision or proprioception. B: histogram of subjects' starting weights (mean of first 4 Wv in Block 1). n = 85, mean = 0.5. The bimodal distribution indicates that subjects began the experiment favoring either vision or proprioception.

