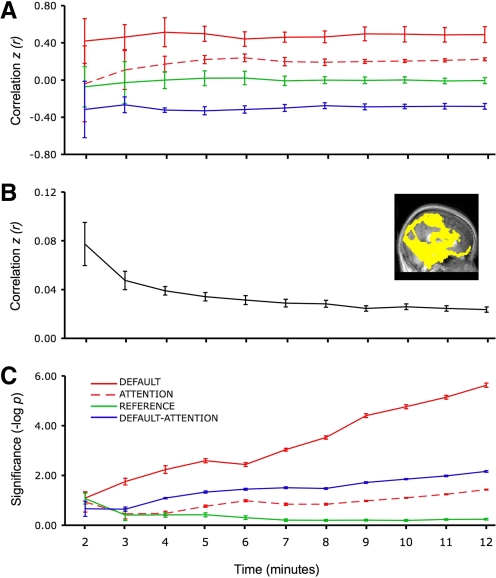
Fig. 11.
Functional connectivity networks can be assessed using brief acquisition times. Functional connectivity analysis was performed for incremental durations of scan times ranging from 2 to 12 min for 6 subjects. A: correlation strengths within and between default, attention, and reference networks. Estimates of correlation strengths stabilize rapidly. B: noise, defined as spurious correlations in selected regions (the inserted image depicts the mask of these regions), decreases with increasing acquisition time. C: the mean within-subject significance probability is plotted for each network to show the ability to detect significant correlations. P values are estimated using a model that computes effective degrees of freedom taking into account the temporal correlation of the time series (see text). Error bars represent SE.

