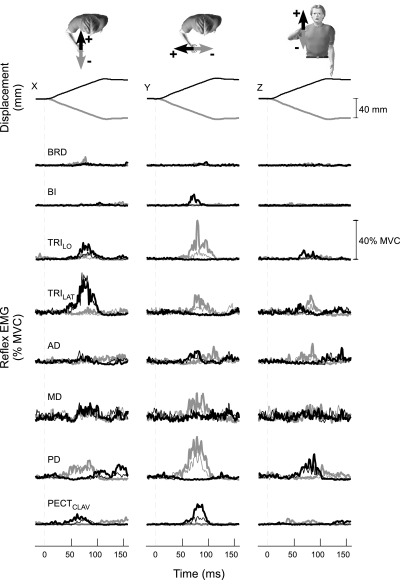
Fig. 5.
Typical average stretch reflexes obtained during interactions with the destabilizing environments used in experiment 1. Responses were obtained from a subject who was applying 10 N laterally, along the secondary axis of endpoint stiffness. Top: the applied perturbations; perturbations applied during interactions with both environments are overlaid but are indistinguishable. The characters at the top of the figure indicate the direction of the applied perturbations; the colors of the arrows are matched to the perturbation traces and the reflex electromyograms (EMGs) below. Thin and thick traces correspond to data recorded during interactions with the environment aligned and orthogonal to endpoint stiffness, respectively. Identical perturbations elicited responses of different magnitude, depending on the environment with which the subject interacted.

