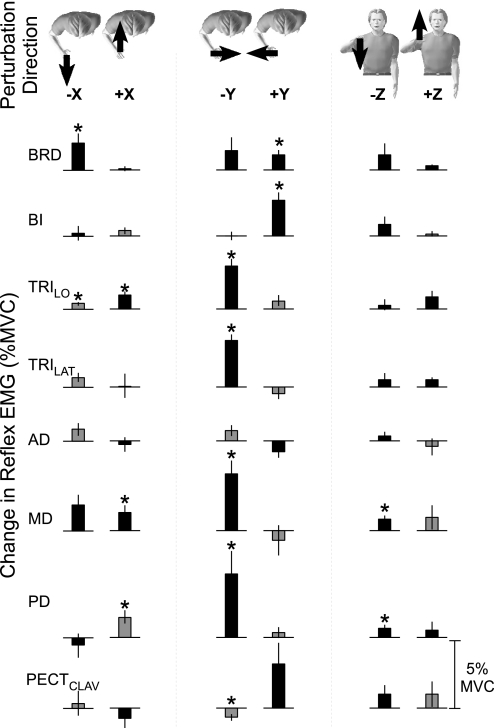
Fig. 6.
Reflex modulation at matched levels of voluntary EMG. Data are group responses. Characters at the top of the figure indicate the direction of the applied perturbation. Each plot indicates the difference between average reflex EMGs (50–100 ms after perturbation onset) recorded during interactions with the environments orthogonal and aligned to maximal endpoint stiffness. Each row indicates the reflexes elicited from a single muscle. The horizontal lines indicate (0) no change in reflex EMG. The color of the bars indicates whether the elicited response is excitatory (black) or inhibitory (gray). Black bars above the horizontal line indicate increased reflex EMG in the environment orthogonal to maximal endpoint stiffness; black bars below the horizontal line indicate decreased reflex EMG during interactions with the environment orthogonal to maximal stiffness. Gray bars below the horizontal line indicate increased inhibition during interactions with the environment orthogonal to maximal stiffness; gray bars above the horizontal line indicate decreased inhibition during interactions with the environment orthogonal to maximal stiffness. Error bars indicate standard errors. Asterisks indicate P < 0.05.

