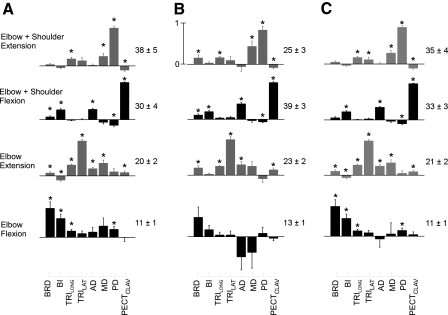
Fig. 7.
Reflex coordination patterns (ICs). ICs were estimated from data pooled across subjects. A: ICs estimated during interactions with the environment orthogonal to the orientation of maximal endpoint stiffness. B: ICs estimated during interactions with the environment aligned to the orientation of maximal endpoint stiffness. C: ICs estimated from data pooled across environments. Each IC was named according to the actions of the most prominent muscles. Data were collected using the protocols of experiment 1. Muscles in each coordination pattern are indicated at the bottom of the figure. The magnitude of the vector described by each 8-muscle pattern was normalized to unity. Numbers to the right of each pattern indicate percentages of the relative variance described by that pattern. Only data remaining after the initial PCA reduction are considered in the relative variance calculation. Error bars indicate SE. *, components that are significant at a level of P < 0.05.

