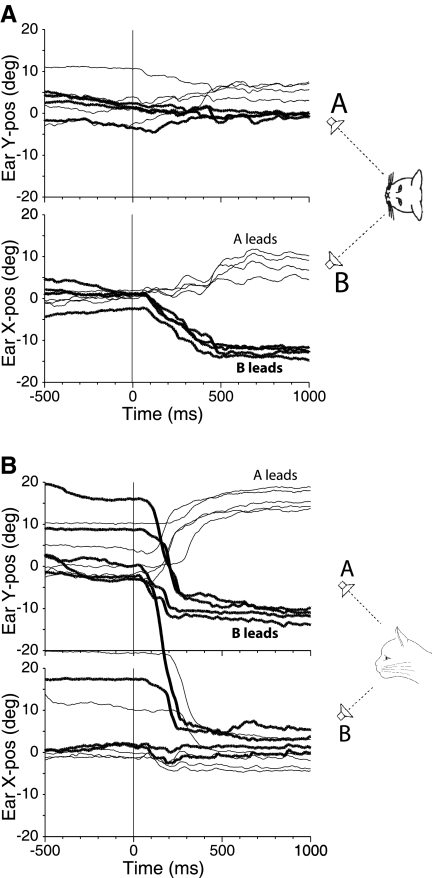
Fig. 3.
Pinna movements (right pinna, cat 21) during 1 day of testing in response to paired source stimuli with ISDs in the localization dominance range. A: speakers were located along the horizontal meridian at (−18, 0°) and (+18, 0°) with ISDs = +1 ms (speaker A leading, thin traces) and ISDs = −1 ms (speaker B leading, thick traces). B: speakers were located along the vertical meridian at (0, +18°) and (0, −23°) with ISDs = +1 ms (speaker A leading, thin traces) and ISD = −1 ms (speaker B leading, thick traces).

