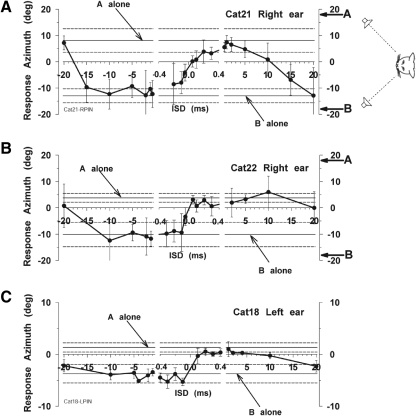
Fig. 6.
Summary plots for 3 cats of the final horizontal pinna position as a function of ISDs for speakers along the horizontal meridian at (±18, 0°) with stimuli mimicking the precedence effect. The middle section of each plot represents ISDs in the summing localization range. The 2 horizontal lines and dashed lines indicate the mean response ± SD to the A and B speakers when delivered as a single source target.

