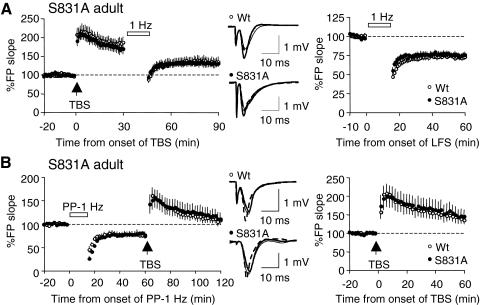
FIG. 5.
Normal depotentiation and dedepression in the adult S831A mutants. A: depotentiation was induced by delivering a train of 1 Hz (15 min) at 30 min following LTP induction by 4 trains of TBS. Left: the entire experiment normalized to the pre-LTP baseline. Middle: superimposed representative traces taken right before LTP induction (thin line), 30 min after LTP (thick solid line), and 1 h after the onset of 1-Hz stimulation (thick dashed line). Right: the magnitude of depotentiation when renormalized to the pre-1-Hz baseline. B: dedepression was induced 1 h following the onset of PP-1-Hz stimulation by delivering 4 trains of TBS. Left: the entire experiment normalized to the pre-LTD baseline. Middle: superimposed representative traces taken right before LTD induction (thin line), 1 h after LTD (thick solid line), and 1 h after TBS (thick dashed line). Right: the magnitude of depotentiation when renormalized to the pre-TBS baseline.

