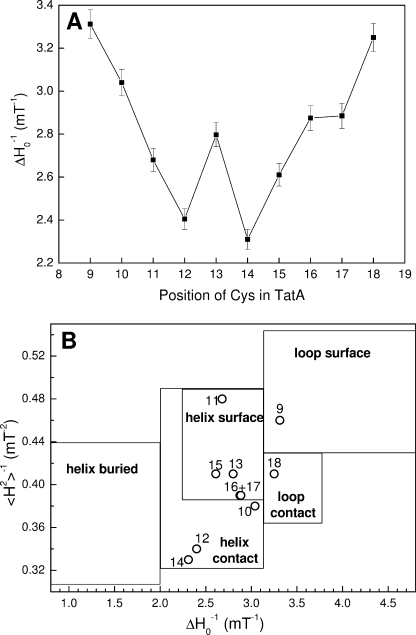
FIGURE 3.
Mobility of spin labels attached to the transmembrane helix of TatA. A, variation of the mobility parameter ΔH0−1 along the transmembrane helix of TatA. The ΔH0−1 values were calculated from the room temperature EPR spectra given in Fig. 2. Error bars are calculated from the results of duplicate sample preparations. B, correlation of the mobility parameters 〈H2〉−1 (inverse second moment) and ΔH0−1 (inverse of the central line width) for spin labels at positions 9–18 within TatA. Mobility parameters were calculated from the room temperature X-band EPR spectra shown in Fig. 2. Assignment of structural environments is based on the compilation of Bordignon and Steinhoff (43).

