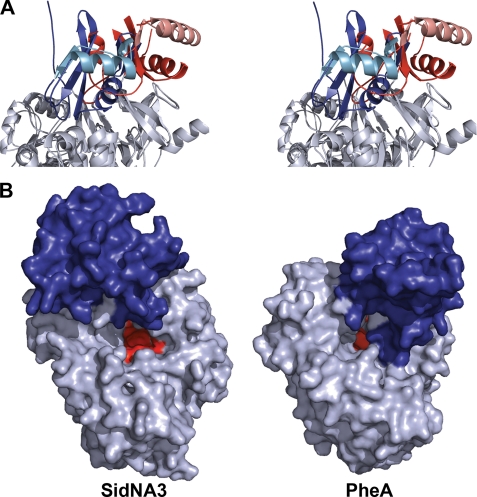
FIGURE 4.
Orientation of the C-terminal domain for SidNA3. A, stereo ribbon diagram showing the orientation of the C-terminal domain in SidNA3 compared with the adenylation conformation of PheA (9). The C-terminal domain of SidNA3 is red and that of PheA is blue. The N-terminal domains have been aligned and are shown in gray. The second α-helix and subsequent β-strand of the C-terminal domains are colored in lighter shades to aid visualization of the rotation between the conformations. B, molecular surface diagram showing the accessibility of the active sites in the open conformation of SidNA3 compared with the adenylation conformation of PheA (9). The amino acid binding pocket is shown in red, and the C-terminal domain is colored blue.

